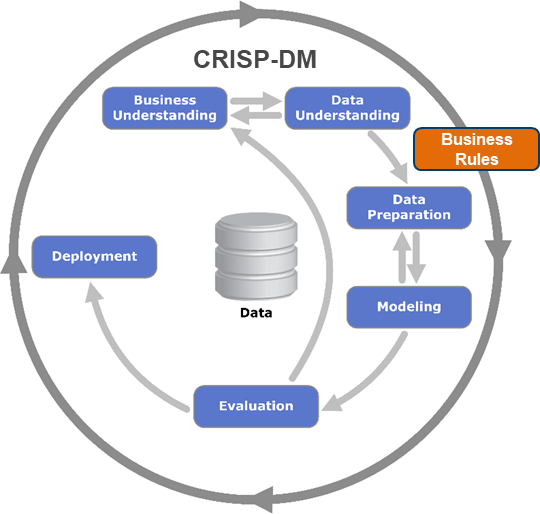
Used car classification and regression
Project Background
This project is a group effort collaboration for Syracuse University’s IST-718 - Big Data Analytics. The project, using pyspark explores a large dataset of car sales data. The motivation behind exploring this dataset stems from the COVID-19 pandemic; specifically in response to the emerging news of car payment re-structuring from many different dealerships. The economic impact of the pandemic must’ve negatively impacted the volume of sales for the automotive retail market as well as peoples ability to finance a car purchase. Our team had heard anectodal evidence of friends and family purchasing used vehicles for lower APR financing deals from dealerships to make up for the loss of business in pandemic times. Since zero/low APR deals on new models were difficult to justify for the dealerships and many people were suffering financially, used cars were being offered at great prices.
This analysis explores a few aspects of what the team thought would be useful information for people looking to purchase or sell used vehicles. In addition to mining inferential patterns and information from the data, there are some components of the analysis which focus on pure classification/prediction performance.
Overview
While a full report can be viewed at the github repository linked below, this section is a rough outline of some of the findings.
Goals
The objectives of the analysis - as briefly touched earlier - was to 1) identify benchmarks and influences on price expectation and price setting, 2) observe time on market behavior and 3) explore the implications of vehicle use and history.
Price
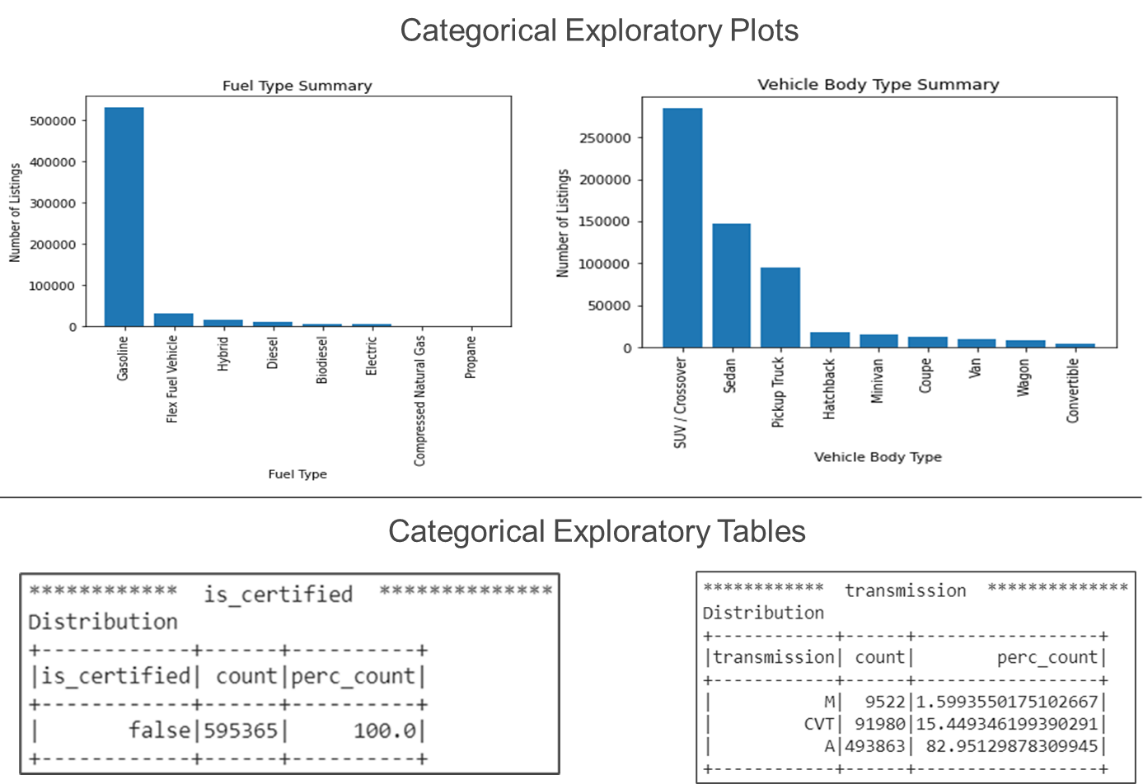
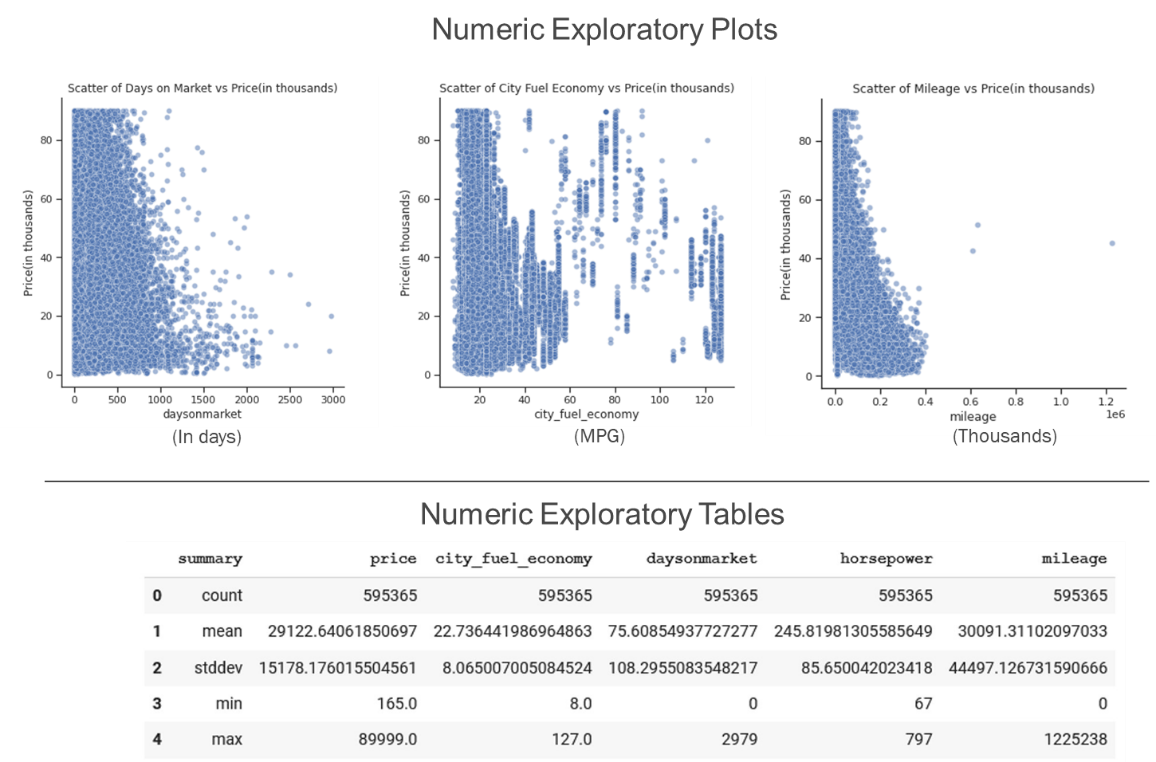
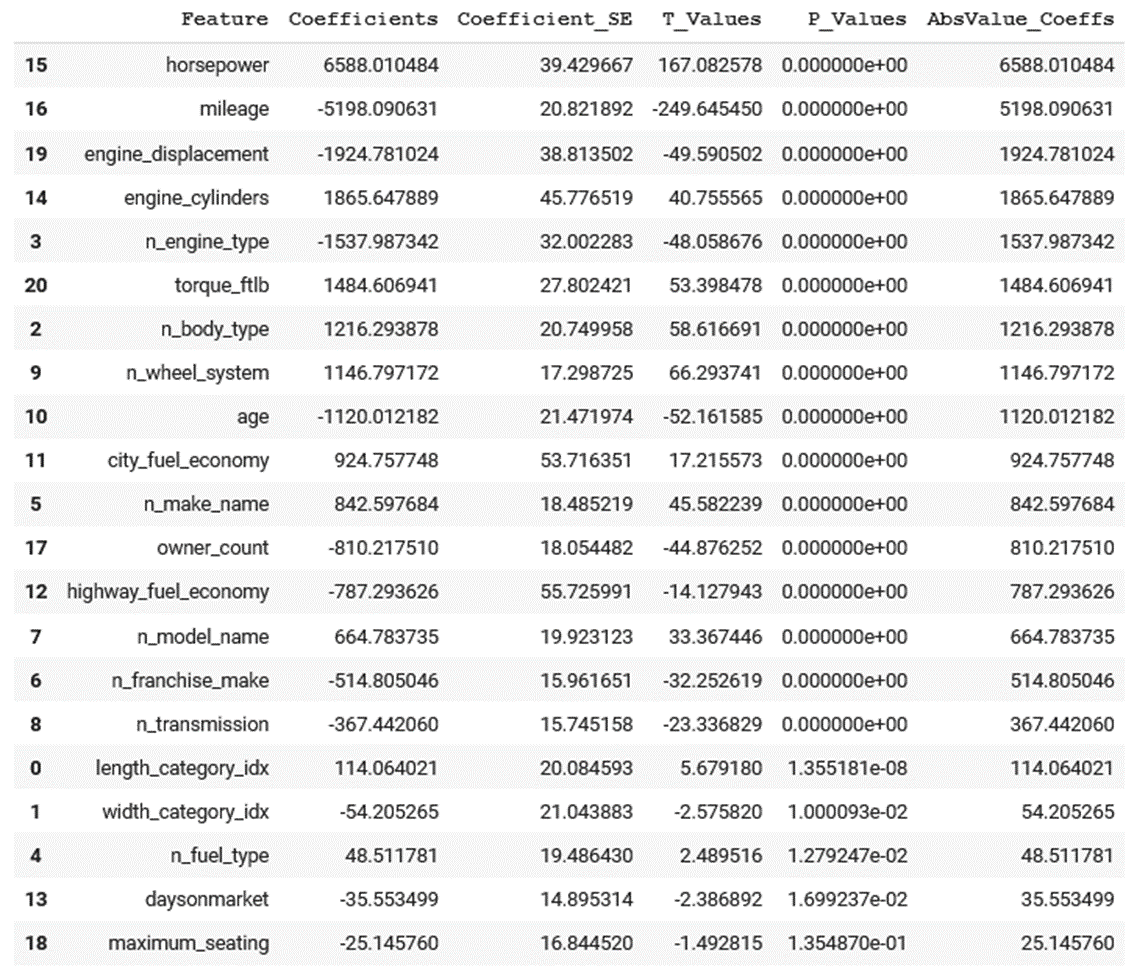
Two different algorithms were deployed to explore price patters; linear regression and random forest (decision tree regressor). Each model was deployed with a twice, each with the same data transformations and feature engineering as their parallel model. First, each model was deployed with minimal feature engineering, resulting the performance identified in the table below.
| Model | Metric | Performance |
|---|---|---|
| Linear Regression | RMSE | 6,772.93 |
| Linear Regression | R-square | 0.703 |
| Random Forest | RMSE | 3,834.69 |
| Random Forest | R-square | 0.905 |
| Linear Regression |
|---|
|
Since these two models were run with minimal feature engineering, these were used to mine inferences in what features effect price. The differences in the direction and magnitude of how different features impacted these features can be seen in the above and below visualizations.
| Random Forest |
|---|
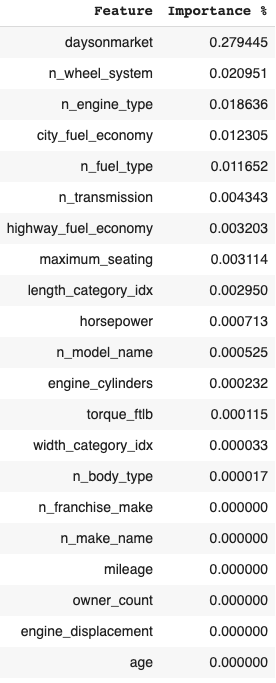
|
The two additional variations of the above models were run purely to test how PCA and K-means data might help increase the performance of each model. These models were virtually useless for interpretive inference as they utilized the same data + 48 artificial features from the PCA and K-means analysis. The performance difference of the same algorithms optimized for the introduction of new features are as follows:
| Model | Metric | Performance |
|---|---|---|
| Linear Regression | RMSE | 6,772.93 |
| Linear Regression | R-square | 0.703 |
| Random Forest | RMSE | 3,834.69 |
| Random Forest | R-square | 0.905 |
Other goals
The remaining analytical points and the discussion of inferences can be seen at the repo where the report and code for this project are currently housed. Collaborators and their personal GitHub repositories can be seen in the table below.
| Collaborators |
|---|
| Ralph Parlin |
| Patrick Prioletti |
| Brian Schramke |
| Kobi Wiseman |